
Copyright D.P. Browne 2011


Predictions
The FMGC computes various predictions for estimated altitudes, speeds and times and updates them continuously during the flight. The predictions are part of the following functions:
Revisions to lateral and vertical flight plans
Current wind and temperatures
Current guidance mode
|
Symbol |
Definition |
|
|
Level Symbol, shown at the Top Of Climb (T/C). It shows the position on the flight plan where the aircraft will reach the cruise altitude. |
|
|
Top Of Decent. This symbol shows where on the flight plan the aircraft will begin the descent flight phase. |
|
|
Start Of Climb, for a step climb. |
|
|
Start Of Descent for a step descent |
|
|
Intercept of the descent flight path. This will correspond to the vertical deviation shown on the progress page during descent. |
|
|
Speed Change symbol. This shows the point where the aircraft will initiate an automatic speed change |
|
|
Deceleration point. This is the point where the aircraft will decelerate for the approach phase. It corresponds to the (DECEL) waypoint in t he flight plan. |
|
|
Constraint symbol. This circle is placed around any waypoint that has a constraint. It is Magenta if it is deemed to be matched, else it is in amber. |
|
|
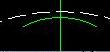
Energy Circle. This is seen only when NAV mode is not active. It represents the required distance to land, based on the FCU altitude. |
|
|
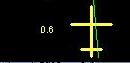
Cross track error. This shows the amount in NM that the aircraft is to the left or the right of the lateral flight path. |
|
Type of Prediction |
MCDU Page |
|
Pseudo waypoints : T/C, T/D., SPD LIM . DECEL | |
|
Time, Speed and Alt at each waypoint | |
|
EFOB, Distance to destination | |
|
ETA, Distance, Waypoint FOB | |
|
Constraints | |
|
Altitude Error | |
|
Time & Distance to selected altitude | |
|
Vertical Deviation | |
|
Fuel predictions | |
|
|
|
These symbols appear on the Nav Display to show the predictions made by the FMGC.